
Why measure anything?
Data, when used wisely, can help you make better decisions as an open source maintainer.
With more information, you can:
- Understand how users respond to a new feature
- Figure out where new users come from
- Identify, and decide whether to support, an outlier use case or functionality
- Quantify your project’s popularity
- Understand how your project is used
- Raise money through sponsorships and grants
For example, Homebrew finds that Google Analytics helps them prioritize work:
Homebrew is provided free of charge and run entirely by volunteers in their spare time. As a result, we do not have the resources to do detailed user studies of Homebrew users to decide on how best to design future features and prioritise current work. Anonymous aggregate user analytics allow us to prioritise fixes and features based on how, where and when people use Homebrew.
Popularity isn’t everything. Everybody gets into open source for different reasons. If your goal as an open source maintainer is to show off your work, be transparent about your code, or just have fun, metrics may not be important to you.
If you are interested in understanding your project on a deeper level, read on for ways to analyze your project’s activity.
Discovery
Before anybody can use or contribute back to your project, they need to know it exists. Ask yourself: are people finding this project?
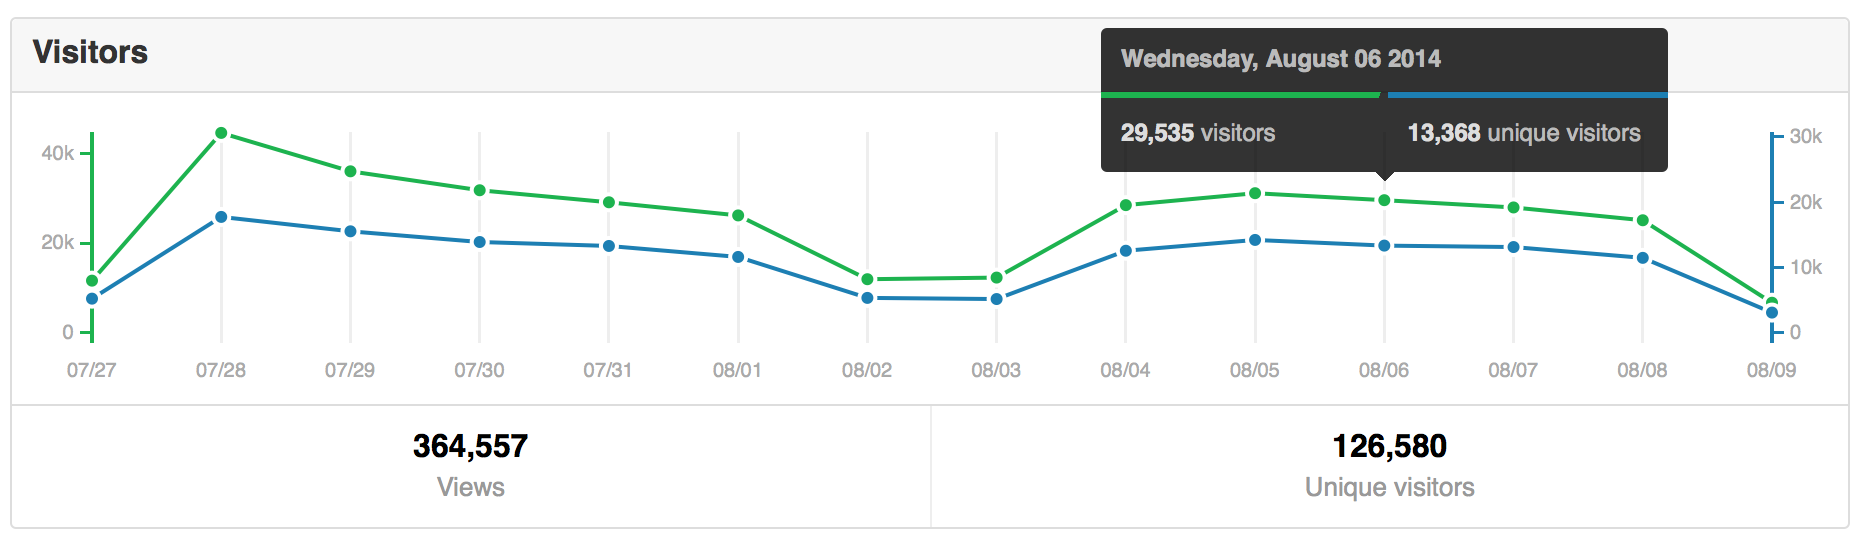
If your project is hosted on GitHub, you can view how many people land on your project and where they come from. From your project’s page, click “Insights”, then “Traffic”. On this page, you can see:
-
Total page views: Tells you how many times your project was viewed
-
Total unique visitors: Tells you how many people viewed your project
-
Referring sites: Tells you where visitors came from. This metric can help you figure out where to reach your audience and whether your promotion efforts are working.
-
Popular content: Tells you where visitors go on your project, broken down by page views and unique visitors.
GitHub stars can also help provide a baseline measure of popularity. While GitHub stars don’t necessarily correlate to downloads and usage, they can tell you how many people are taking notice of your work.
You may also want to track discoverability in specific places: for example, Google PageRank, referral traffic from your project’s website, or referrals from other open source projects or websites.
Usage
People are finding your project on this wild and crazy thing we call the internet. Ideally, when they see your project, they’ll feel compelled to do something. The second question you’ll want to ask is: are people using this project?
If you use a package manager, such as npm or RubyGems.org, to distribute your project, you may be able to track your project’s downloads.
Each package manager may use a slightly different definition of “download”, and downloads do not necessarily correlate to installs or use, but it provides some baseline for comparison. Try using Libraries.io to track usage statistics across many popular package managers.
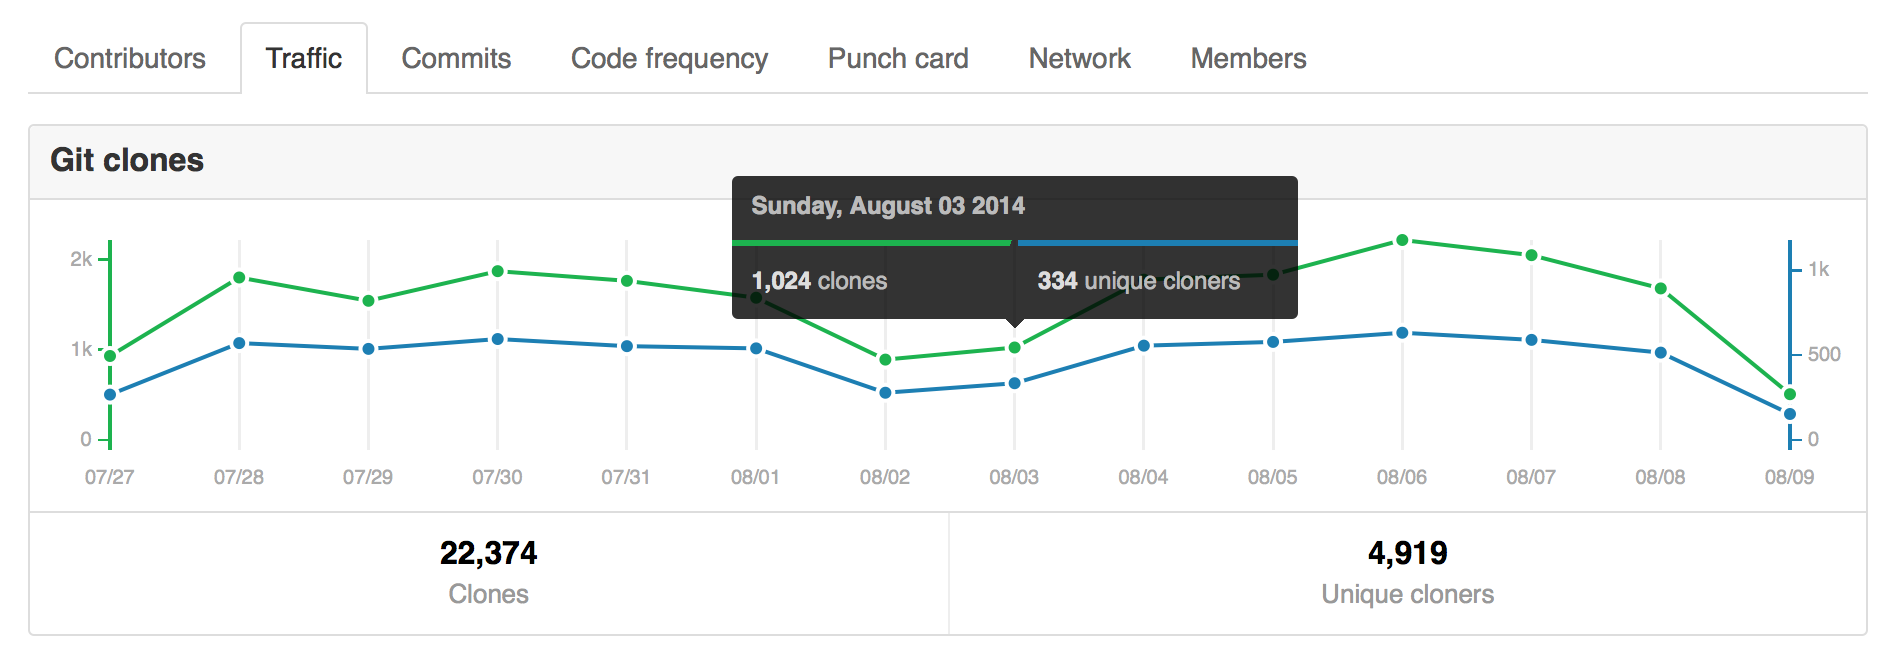
If your project is on GitHub, navigate again to the “Traffic” page. You can use the clone graph to see how many times your project has been cloned on a given day, broken down by total clones and unique cloners.
If usage is low compared to the number of people discovering your project, there are two issues to consider. Either:
- Your project isn’t successfully converting your audience, or
- You’re attracting the wrong audience
For example, if your project lands on the front page of Hacker News, you’ll probably see a spike in discovery (traffic), but a lower conversion rate, because you’re reaching everyone on Hacker News. If your Ruby project is featured at a Ruby conference, however, you’re more likely to see a high conversion rate from a targeted audience.
Try to figure out where your audience is coming from and ask others for feedback on your project page to figure out which of these two issues you’re facing.
Once you know that people are using your project, you might want to try to figure out what they are doing with it. Are they building on it by forking your code and adding features? Are they using it for science or business?
Retention
People are finding your project and they’re using it. The next question you’ll want to ask yourself is: are people contributing back to this project?
It’s never too early to start thinking about contributors. Without other people pitching in, you risk putting yourself into an unhealthy situation where your project is popular (many people use it) but not supported (not enough maintainer time to meet demand).
Retention also requires an inflow of new contributors, as previously active contributors will eventually move on to other things.
Examples of community metrics that you may want to regularly track include:
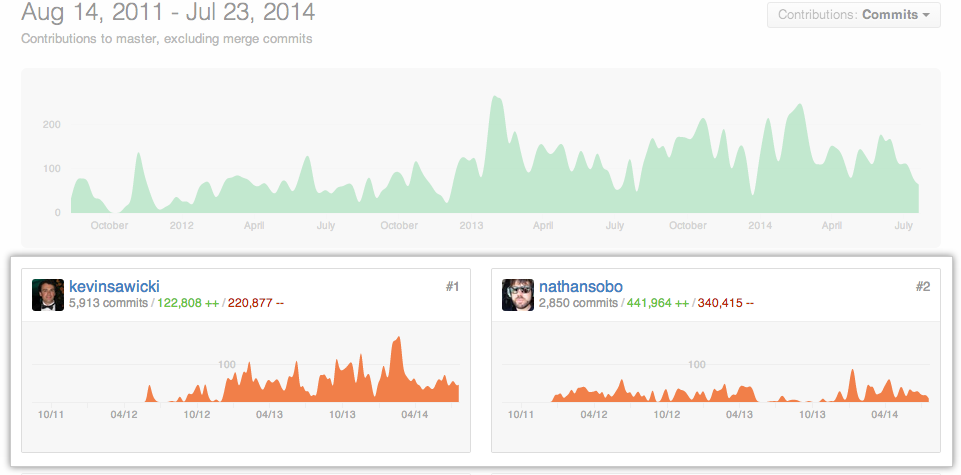
- Total contributor count and number of commits per contributor: Tells you how many contributors you have, and who’s more or less active. On GitHub, you can view this under “Insights” -> “Contributors.” Right now, this graph only counts contributors who have committed to the default branch of the repository.
-
First time, casual, and repeat contributors: Helps you track whether you’re getting new contributors, and whether they come back. (Casual contributors are contributors with a low number of commits. Whether that’s one commit, less than five commits, or something else is up to you.) Without new contributors, your project’s community can become stagnant.
-
Number of open issues and open pull requests: If these numbers get too high, you might need help with issue triaging and code reviews.
-
Number of opened issues and opened pull requests: Opened issues means somebody cares enough about your project to open an issue. If that number increases over time, it suggests people are interested in your project.
-
Types of contributions: For example, commits, fixing typos or bugs, or commenting on an issue.
Maintainer activity
Finally, you’ll want to close the loop by making sure your project’s maintainers are able to handle the volume of contributions received. The last question you’ll want to ask yourself is: am I (or are we) responding to our community?
Unresponsive maintainers become a bottleneck for open source projects. If someone submits a contribution but never hears back from a maintainer, they may feel discouraged and leave.
Research from Mozilla suggests that maintainer responsiveness is a critical factor in encouraging repeat contributions.
Consider tracking how long it takes for you (or another maintainer) to respond to contributions, whether an issue or a pull request. Responding doesn’t require taking action. It can be as simple as saying: “Thanks for your submission! I’ll review this within the next week.”
You could also measure the time it takes to move between stages in the contribution process, such as:
- Average time an issue remains open
- Whether issues get closed by PRs
- Whether stale issues get closed
- Average time to merge a pull request
Use 📊 to learn about people
Understanding metrics will help you build an active, growing open source project. Even if you don’t track every metric on a dashboard, use the framework above to focus your attention on the type of behavior that will help your project thrive.
CHAOSS is a welcoming, open source community focused on analytics, metrics and software for community health.

